Note
This document is part of the dune-fem tutorial
Jupyter notebook (_nb.ipynb) or as Python script (.py)Examples of grid construction
In addition to the already discussed construction of Cartesian grid using dune.grid.structuredGrid and dune.grid.cartesianDomain and the usage of dictionaries discussed in the general concepts section, it is also possible to read grid files using either the DGF or gmsh format (or other formats available through the meshio package).
[1]:
import numpy
from matplotlib import pyplot
from dune.alugrid import aluSimplexGrid as leafGridView
from dune.grid import OutputType, reader
from dune.fem.space import lagrange as solutionSpace
from dune.fem.scheme import galerkin as solutionScheme
from ufl import TestFunction, TrialFunction, SpatialCoordinate
from ufl import dx, grad, grad, dot, inner, conditional, sin
Example using the Dune Grid Format (DGF)
Please read the Dune Grid Format (DGF) for a detailed description of DGF. The format works for 2d or 3d and most DUNE grids can be constructed using a DGF file. The format allows easy description of boundary ids (see below) and parameters. See the section about boundary conditions to learn how to use these in a weak form.
Note
The DGF is ASCII based and thus only meant for prototyping and testing. For serious computations use meshio or the pickling approach.
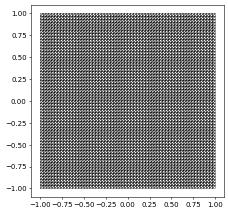
We start with a simple grid of triangles
[2]:
domain2d = (reader.dgf, "triangle.dgf")

# specify dimgrid since it cannot be easily extracted from the dgf file
aluView = leafGridView(domain2d, dimgrid=2)
aluView.plot(figsize=(5,5))
Using gmsh/pygmsh
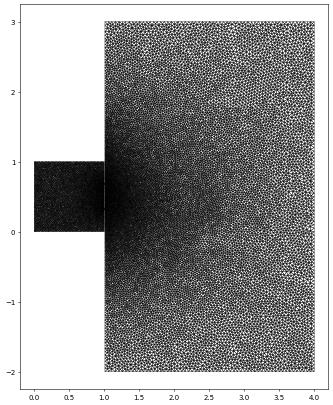
There is also a reader.gmsh option allowing previously stored gmsh files to be read. The grid file is the one used in the wave equation example.
[3]:
waveDomain = (reader.gmsh, "wave_tank.msh")
waveGrid = leafGridView(waveDomain, dimgrid=2)
waveGrid.plot(figure=pyplot.figure(figsize=(10,10)))
3D example (using PyGmsh)
In this example we use pygmsh to construct a tetrahedral mesh and solve a simple Laplace problem. The following code is taken from the pygmsh homepage.
[4]:
try:
    import pygmsh
    with pygmsh.geo.Geometry() as geom:
        poly = geom.add_polygon([
              [ 0.0,  0.5, 0.0], [-0.1,  0.1, 0.0], [-0.5,  0.0, 0.0],
              [-0.1, -0.1, 0.0], [ 0.0, -0.5, 0.0], [ 0.1, -0.1, 0.0],
              [ 0.5,  0.0, 0.0], [ 0.1,  0.1, 0.0] ], mesh_size=0.05)
        geom.twist(
            poly,
            translation_axis=[0, 0, 1], rotation_axis=[0, 0, 1], point_on_axis=[0, 0, 0],
            angle=numpy.pi / 3,
        )
        mesh = geom.generate_mesh(verbose=False)

    points, cells = mesh.points, mesh.cells_dict
    domain3d = {"vertices":points.astype("float"), "simplices":cells["tetra"]}
except ImportError: # pygmsh not installed - use a simple cartesian domain
    print("pygmsh module not found using a simple Cartesian domain - ignored")
    from dune.grid import cartesianDomain
    domain3d = cartesianDomain([-0.25,-0.25,0],[0.25,0.25,1],[30,30,60])

gridView3d  = leafGridView(domain3d)
space3d = solutionSpace(gridView3d, order=1)

u = TrialFunction(space3d)
v = TestFunction(space3d)
x = SpatialCoordinate(space3d)
scheme3d = solutionScheme((inner(grad(u),grad(v))+inner(u,v))*dx ==
                        conditional(dot(x,x)<.01,100,0)*v*dx,
                        solver='cg')

uh3d = space3d.interpolate([0],name="solution")
scheme3d.solve(target=uh3d)
# note: plotting with matplotlib not yet available for 3d grids
gridView3d.writeVTK('3dexample', pointdata=[uh3d],
                    outputType=OutputType.appendedraw)

Converting a mesh to DGF
Using the above convenient way of generating grids in Python we can then store those as DGF which allows to add boundary ids of vertex and element parameters in a simple way (see next section).
[5]:
from dune.grid.mesh2dgf import mesh2DGF
from dune.grid import reader

dgf, _,_ = mesh2DGF((points, cells))
domain3d = (reader.dgfString, dgf)
gridView3d  = leafGridView(domain3d, dimgrid=3)
Tip
Store the DGF mesh to a file for later reuse with reader.dgf, see above.
[6]:
with open ("3dmesh.dgf", "w") as file:
    file.write(dgf)
Using meshio to read a gmsh file
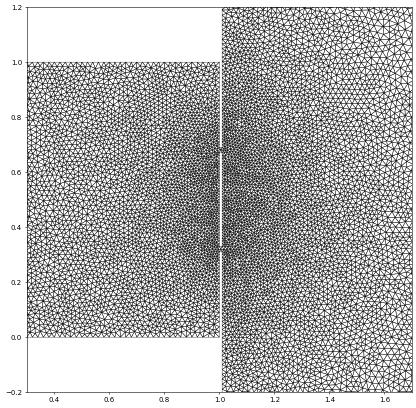
We will use the meshio package to read a gmsh file, extract the points and cells and use that to construct a Dune grid. The final part is then quite similar to the above. We use the 2D grid from the wave equation test case. Note that this is a 2D grid but the points are returned as 3D points so we need to remove the final columns containing only zeros. We have already seen this grid above so let’s zoom in to the ‘slit’ region…
[7]:
try:
    import numpy as np
    import meshio
    mesh = meshio.read("wave_tank.msh")
    points = np.delete( mesh.points, 2, 1) # remove the z component from the points
    cells = mesh.cells_dict
    waveDomain = {"vertices":points.astype("float"), "simplices":cells["triangle"]}
    waveGrid = leafGridView(waveDomain)
    waveGrid.plot(figure=pyplot.figure(figsize=(10,10)),xlim=[0.3,1.7],ylim=[-0.2,1.2])
except ImportError:
    print("This example requires the meshio package which can be installed using pip.")
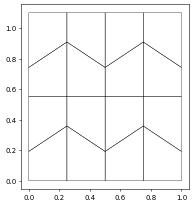
Here is a second example where we want to read a gmsh file containing quadrilateral elements. Note that the vertices of the cells are ordered counterclockwise which is not identical to the ordering required by the Dune reference element. The last two vertices need to be exchanged:
[8]:
if meshio:
    from dune.alugrid import aluCubeGrid
    mesh = meshio.read("quads.msh")
    points2d = np.delete(mesh.points,2,1)
    cells = mesh.cells_dict['quad']
    cells[:, [2, 3]] = cells[:, [3, 2]]
    domain = {"vertices":points2d, "cubes":cells}
    quadGrid  = aluCubeGrid(domain)
    quadGrid.plot()
Providing IDs for boundary conditions using dgf and gmsh/pygmsh
Note
the following only works with the grid managers from the dune.alugrid package:
Attaching boundary ids to a grid constructed with gmsh using DGF
The Dune Grid Format (DGF) allows to either specify BoundarySegments or a BoundaryDomain. Boundary segments require to specify a boundary id for a selection of intersections of an element with the boundary, e.g. a collection of edges of triangles located on the boundary. For testing and prototyping it is very convenient to use the boundary domain approach instead, where for each boundary id (short:
bnd id) a bounding box is described and each boundary segment that is found inside this box is assigned the bnd id. This approach also allows to specify a default value which is assigned to all segments not found in any of the specified boxes. This approach works in 2d as well as 3d.
Tip
Specify the bounding box for simple boundaries such as outer walls and straight lines and surfaces and use the default value to mark a particularly complex boundary in the interior.
[9]:
try:
    with pygmsh.occ.Geometry() as geom:

        # Define domain
        L = 1; H = 1
        # circles
        c = 0.2; r = 0.05

        # Grid size function
        def size(dim, tag, x, y, z, lc):
            resolution = 0.1
            d = ((x - c)**2 + (y - c)**2)**0.5
            if d < 3 * r:
                return 0.4*resolution

            d = ((x - (1-c))**2 + (y - (1-c))**2)**0.5
            if d < 3 * r:
                return 0.4*resolution

            # default is a coarser mesh
            return resolution

        # create rectangle and circles
        rectangle = geom.add_rectangle([0, 0, 0], L, H)
        obs1 = geom.add_ball([c, c, 0], r)
        obs2 = geom.add_ball([1-c, 1-c, 0], r)
        # subtract the two obstacles from the volume to create holes
        geom.boolean_difference(rectangle, [obs1, obs2])
        geom.set_mesh_size_callback(size)
        mesh = geom.generate_mesh(dim=2)

        eps = 0.01 # tolerance
        # lower left circle min and max
        c1 = [c - r - eps, c + r + eps]
        # upper right circle min and max
        c2 = [(1-c) - r - eps, (1-c) + r + eps]

        # dictionary containing id and a list containing the lower left and upper right corner of the bounding box
        bndDomain = {1: [[-1.0 , -1.0 ], [0.0  , H+0.1]], # bounding box inflow
                     2: [[   L , -1.0 ], [L+1.0, H+0.1]], # bounding box outflow
                     4: [[c1[0], c1[0]], [c1[1], c1[1]]], # bounding box lower left circle
                     5: [[c2[0], c2[0]], [c2[1], c2[1]]], # bounding box upper right circle
                     3: "default"  # top and bottom wall,
                     # which are all other segments not contained in the above bounding boxes
                    }

        # return dgf string which can be read by DGF parser or written to file for later use
        dgf, _,_ = mesh2DGF((mesh.points, mesh.cells_dict), bndDomain=bndDomain, dim=2)
        domain2d = (reader.dgfString, dgf)
except ImportError: # pygmsh not installed - use a simple cartesian domain
    print("pygmsh module not found using a simple Cartesian domain - ignored")
    from dune.grid import cartesianDomain
    domain2d = cartesianDomain([-0.25,-0.25],[0.25,0.25],[30,30])

gridView2d = leafGridView(domain2d, dimgrid=2)
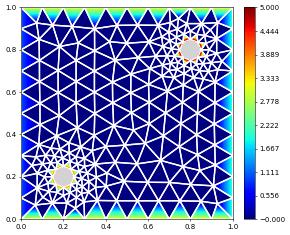
Visualizing Boundary Ids
After construction of a grid we can visualize boundary ids by assigning a discontinuous piecewise linear function to hold the value of boundary faces (and zero towards the interior).
[10]:
from dune.fem.function import boundaryFunction
fig = pyplot.figure()
boundaryFunction( gridView2d).plot(gridLines="white",linewidth=2,figure=fig)
fig.get_axes()[0].set_facecolor("lightgray")
Using gmsh’s ‘add_physical` to set boundary ids
This is the same basic geometry as above:
[11]:
import tempfile
import gmsh
import dune.alugrid

# Initialize empty geometry using the build in kernel in GMSH
with pygmsh.geo.Geometry() as geom:
    L,H = 1, 1
    c,r = 0.2, 0.05
    # Grid size function
    def size(dim, tag, x, y, z, lc):
        resolution = 0.1
        d = ((x - c)**2 + (y - c)**2)**0.5
        if d < 3 * r:
            return 0.4*resolution

        d = ((x - (1-c))**2 + (y - (1-c))**2)**0.5
        if d < 3 * r:
            return 0.4*resolution

        # default is a coarser mesh
        return resolution

    # Add obstacle
    obs1 = geom.add_circle([c,c,0], r)
    obs2 = geom.add_circle([1-c,1-c,0], r)
    # Add points with finer resolution on left side
    points = [
        geom.add_point((0, 0, 0)),
        geom.add_point((L, 0, 0)),
        geom.add_point((L, H, 0)),
        geom.add_point((0, H, 0))
      ]
    # Add lines between all points creating the rectangle
    rectangle = [
        geom.add_line(points[i], points[i + 1]) for i in range(-1, len(points) - 1)
      ]
    # Create a line loop and plane surface for meshing
    rect_loop = geom.add_curve_loop(rectangle)
    surface = geom.add_plane_surface(rect_loop, holes=[obs1.curve_loop,obs2.curve_loop])

    # Call gmsh kernel before add physical entities
    geom.synchronize()

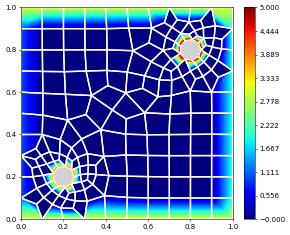
    # add boundary markers (this autoassigns numbers 0,1,2,)
    # we need to add the option to renumber the names in the importMesh
    # function (gmsh.field_data["inflow"][1] = 2 for example)
    geom.add_physical([rectangle[0]], "Inflow")                 # 1
    geom.add_physical([rectangle[2]], "Outflow")                # 2
    geom.add_physical([surface], "Fluid")                       # 3 (will be ignored during import)
    geom.add_physical(obs1.curve_loop.curves, "Obstacle1")      # 4
    geom.add_physical(obs2.curve_loop.curves, "Obstacle2")      # 5

    geom.set_mesh_size_callback(size)
    geom.generate_mesh(dim=2, verbose=True, algorithm=8)
    gmsh.model.mesh.recombine()

    with tempfile.NamedTemporaryFile(suffix=".msh") as f:
        gmsh.write(f.name)
        # import mesh using '3' as default boundary id (for top/bottom) -
        # if not prescribed then '1' will be used
        gridView = dune.alugrid.aluGrid((reader.meshio,f.name),defaultBndId=3)

fig = pyplot.figure()
boundaryFunction(gridView).plot(gridLines="white",linewidth=2, figure=fig)
fig.get_axes()[0].set_facecolor("lightgray")
Info    : Meshing 1D...
Info    : [  0%] Meshing curve 1 (Circle)
Info    : [ 20%] Meshing curve 2 (Circle)
Info    : [ 30%] Meshing curve 3 (Circle)
Info    : [ 40%] Meshing curve 4 (Circle)
Info    : [ 50%] Meshing curve 5 (Circle)
Info    : [ 60%] Meshing curve 6 (Circle)
Info    : [ 70%] Meshing curve 7 (Line)
Info    : [ 80%] Meshing curve 8 (Line)
Info    : [ 90%] Meshing curve 9 (Line)
Info    : [100%] Meshing curve 10 (Line)
Info    : Done meshing 1D (Wall 0.00300907s, CPU 0.00351s)
Info    : Meshing 2D...
Info    : [  0%] Meshing surface 1 (Plane, Frontal-Delaunay for Quads)
Info    : [ 40%] Meshing surface 2 (Plane, Frontal-Delaunay for Quads)
Info    : [ 70%] Meshing surface 3 (Plane, Frontal-Delaunay for Quads)
Info    : Done meshing 2D (Wall 0.00998813s, CPU 0.010142s)
Info    : 210 nodes 444 elements
Info    : Recombining 2D mesh...
Info    : Blossom recombination completed (Wall 0.000280692s, CPU 0.000279s): 6 quads, 1 triangles, 0 invalid quads, 0 quads with Q < 0.1, avg Q = 0.698908, min Q = 0.444444
Info    : Blossom recombination completed (Wall 0.000263725s, CPU 0.00062s): 6 quads, 1 triangles, 0 invalid quads, 0 quads with Q < 0.1, avg Q = 0.698835, min Q = 0.444444
Info    : Blossom: 493 internal 57 closed
Info    : Blossom recombination completed (Wall 0.00616678s, CPU 0.006772s): 173 quads, 0 triangles, 0 invalid quads, 0 quads with Q < 0.1, avg Q = 0.758466, min Q = 0.383231
Info    : Done recombining 2D mesh (Wall 0.0067928s, CPU 0.007748s)
Info    : Writing '/tmp/tmpy70a_2an.msh'...
Info    : Done writing '/tmp/tmpy70a_2an.msh'
Warning : Cannot apply Blossom: odd number of triangles (13) in surface 1
Warning : Cannot apply Blossom: odd number of triangles (13) in surface 2
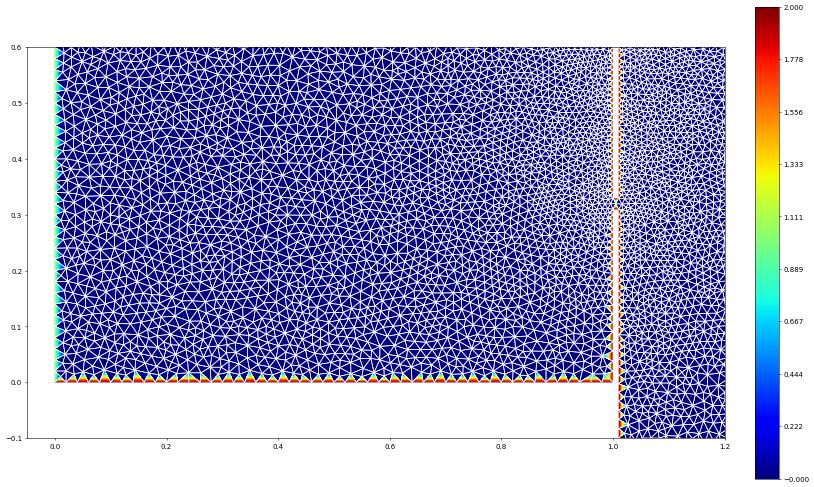
The wave_tank mesh file already used previously also contains boundary tags. An simple way of extracting the grid and keeping the boundary ids is to use the meshio reader:
[12]:
gridView = dune.alugrid.aluGrid((reader.meshio,"wave_tank.msh"))
boundaryFunction(gridView).plot(gridLines="white", linewidth=1,
                figure=pyplot.figure(figsize=(16,10)),xlim=[-0.05,1.2],ylim=[-0.1,0.6] )
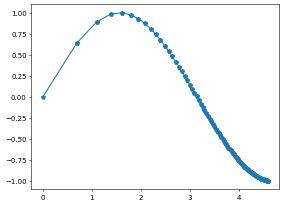
1D example
It’s also possible to create grids in 1D
[13]:
from dune.grid import onedGrid
v = [numpy.log(i) for i in range(1,100)]
e = [(i,i+1) for i in range(1,len(v))]
g = onedGrid(constructor={"vertices":v, "simplices":e})
s = solutionSpace(g)
x = SpatialCoordinate(s)
u = s.interpolate(sin(x[0]), name="u")
u.plot()
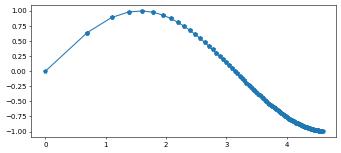
pyplot can very easily be used in 1d using the tessellate method on the grid which will be described in more detail in the section about the bindings for the full dune grid interface.
[14]:
pyplot.plot(g.tessellate()[0], u.pointData(), '-p')
[14]:
[<matplotlib.lines.Line2D at 0x7914cc06fa70>]
Note
This document is part of the dune-fem tutorialJupyter notebook (.ipynb) or as Python script (.py)